Color Analysis: Sum & Count Cells by Color in Excel
Color-coded your Excel cells but need to count or sum by color? There's no built-in formula for that — Color Analysis does it automatically and outputs the stats to a new sheet.
Essential Settings for Color Analysis
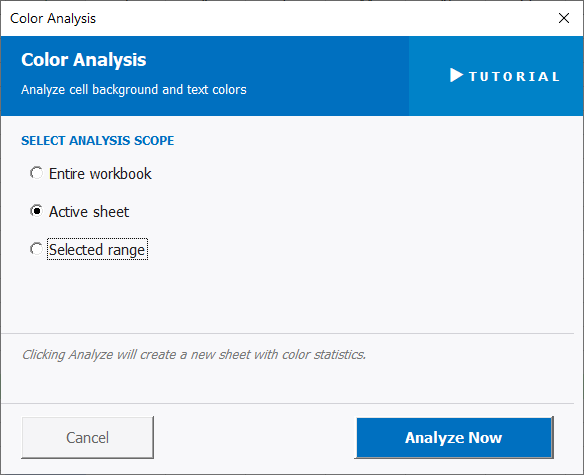
To open Color Analysis, go to the XLclick tab, find the Graphics group, then click Color Analysis.
The panel has one setting:
SELECT ANALYSIS SCOPE — Choose the range to analyze:
- Entire workbook — scans all cells across every sheet and groups results by color across the whole file.
- Active sheet — analyzes only the currently visible sheet.
- Selected range — analyzes only the cells you have highlighted before opening the tool.
Once you click Analyze Now, the tool creates a new sheet with a color statistics report. For each distinct background color found, it shows the count of cells with that color and the sum of their numeric values — giving you instant totals by color without writing a single formula.
Click Analyze Now to run, or Cancel to exit.
Real-World Scenarios: Top Use Cases for Excel Color Analysis
A Project Manager Counting Tasks by Priority Color Without Writing Formulas
A project manager maintained a task tracker in Excel where cells were color-coded by priority — red for urgent, yellow for in progress, green for done. She needed to report how many tasks were in each category, but there's no native Excel formula that counts by cell color. Manually counting was impractical with 150 tasks.
Color Analysis on the Active sheet produced a color statistics report in seconds — count and sum for each color. The priority breakdown was ready to copy into the status report immediately.
A Freelance Bookkeeper Summing Flagged Transactions Highlighted in Red
A freelance bookkeeper had a transactions list in Excel where she manually highlighted suspicious or disputed items in red during reconciliation. At month end, the client wanted the total value of all flagged transactions — but SUMIF doesn't work on cell colors, and there were hundreds of rows.
Color Analysis scanned the sheet and returned the sum of all red-highlighted cells automatically. The disputed total was extracted in seconds without any formula work.
A Small Business Owner Totaling Sales by Sales Rep Using Color-Coded Rows
A small business owner color-coded her sales log by sales rep — each rep had a different row color. At the end of the month, she needed each rep's total sales figure. Without a structured rep column, SUMIF wouldn't work, and manually adding up each color-coded group was tedious.
Color Analysis on the Active sheet returned the sum for each color group instantly. Each rep's monthly total was available in the results sheet in one click.
A Marketing Team Counting Campaign Statuses Tracked by Color Across Multiple Sheets
A marketing team tracked campaign status across a multi-sheet workbook — each sheet for a different quarter — using color-coded cells: blue for planned, orange for live, gray for completed. At a quarterly review, they needed totals across all sheets. Manual counting across sheets was not realistic.
Color Analysis with Entire workbook selected aggregated the color counts across every sheet at once. The quarterly status summary was produced in one click and pasted straight into the review slides.
An Operations Manager Summing Hours Logged by Team Color-Coding in a Shift Schedule
An operations manager maintained a shift schedule in Excel where each team member's shifts were highlighted in a unique color. At payroll time, he needed the total hours for each team member — but the schedule had no structured name column, only colors. Calculating manually was slow and error-prone.
Color Analysis returned the sum of hours per color in seconds. Each team member's total hours for the pay period were extracted from the results sheet and entered into payroll immediately.

Excel has always been my laboratory. After years of navigating data-heavy workflows, I created XLclick: the definitive add-in that simplifies complex analysis into a single click. It’s built for pros who want to spend less time on spreadsheets and more time on strategy.