
7 Excel Financial Reporting Hacks to Clean Up Your Statements Fast
Anyone who works in finance, accounting, or business administration knows the routine. Month-end closes. Quarterly statement preparation. Budget reconciliations. The data comes out of the management software — or ERP, or billing system, or payroll platform — and lands in Excel in some combination of unusable formats, missing values, duplicate entries, and cells that look like numbers but refuse to calculate. Before you can actually report on anything, you have to fix everything.
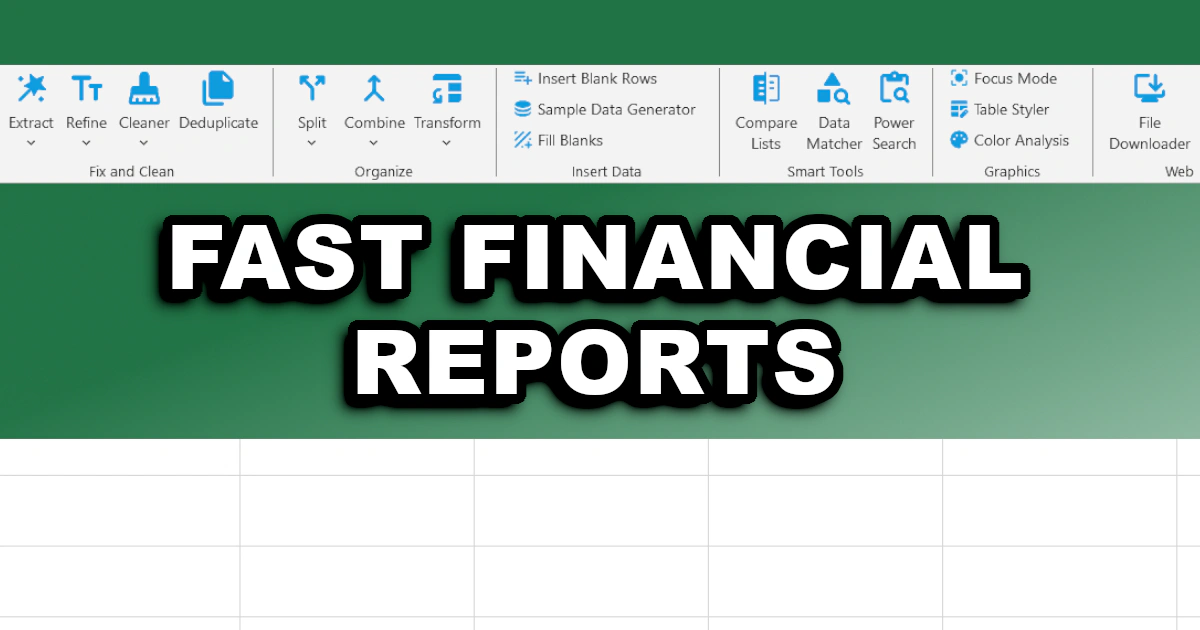
This is not a skill gap. It's a tooling gap. Excel is powerful, but it wasn't built specifically for the kind of financial data cleanup that accountants and finance teams deal with daily. XLclick fills that gap with 34 tools built directly into the Excel ribbon — each one replacing a common, time-consuming manual operation with a single click. Here are 7 practical hacks for cleaning up financial statements and accounting exports faster than you thought possible.
1. Reconciling Payment Lists Against Invoices Without Errors
One of the most common — and most stressful — tasks in accounting is payment reconciliation: comparing what was invoiced against what was actually received, and finding what's missing, what's duplicated, and what matches. In Excel, this usually means writing VLOOKUP formulas, manually scanning for gaps, or color-coding rows by hand. With large datasets, this process is slow and error-prone enough that mistakes are almost inevitable.
The Compare Lists tool makes reconciliation a one-click operation. Select your two lists — invoices in one column, confirmed payments in another — and the tool produces a clean results sheet with three columns: items only in the first list, items only in the second, and items that appear in both. In a payment reconciliation workflow, that instantly tells you which invoices are unpaid, which payments have no matching invoice, and which are correctly settled. No formulas, no manual scanning, no missed entries.
2. Analyzing Costs by Cell Color
Many finance teams use color-coding in Excel as a quick visual classification system: red for overdue, yellow for pending approval, green for confirmed, orange for disputed. It's an intuitive shorthand that works well for day-to-day review — until someone asks for a total of all the red cells, or a count of everything flagged as pending. There is no native Excel formula that sums or counts by cell background color, which means the only option is usually a manual filter-and-add process.
The Color Analysis tool solves this directly. Set the scope — current sheet, entire workbook, or a specific selected range — and click Analyze Now. The tool generates a new sheet with a complete color statistics report: for every distinct background color found in the selection, it shows both the count of cells with that color and the sum of their numeric values. For a finance team that tracks budget line items by color, this turns a manual calculation into an instant, repeatable analysis.
3. Freezing Formulas Before Sending the Final Statement
Before a financial report leaves your hands — whether it's going to a client, a board, an auditor, or another department — the formulas need to go. Sending a file with live formulas means the recipient can accidentally break calculations, see internal logic that shouldn't be visible, or trigger errors when the source data isn't available on their machine. Converting every formula to its calculated value is standard practice, but doing it correctly across multiple sheets requires care.
The Data Fixer tool includes a dedicated option to freeze formulas — replacing all formula cells with their current calculated results — across the current sheet or the entire workbook in one operation. The numbers stay exactly as they are. The formulas disappear. It also handles related cleanup tasks in the same pass: removing leftover colors and formatting from imported data, converting text strings to proper numbers, and activating clickable hyperlinks from plain-text URLs. Everything a finance file needs before it goes out the door.
4. Splitting a Consolidated Report Into Separate Department Files
A consolidated company budget or expense report often lives in a single Excel workbook with one sheet per department — 10, 15, sometimes 20 tabs. At reporting time, each department head needs their own standalone file with only their data. Finance managers know the drill: open the workbook, go to sheet one, File > Save As, name it, repeat. For 15 departments, that's 15 identical save operations, and getting a file name wrong or accidentally including the wrong sheet is a real risk under deadline pressure.
The Mass Sheet Exporter tool exports every visible sheet in the workbook as its own individual Excel file in one single operation. Choose the file format and the destination folder, click Export Now, and every sheet is saved as a standalone file named after its tab — automatically, simultaneously, without opening or closing anything manually. A task that used to take 20 minutes of focused clicking now takes under 10 seconds, with no risk of saving the wrong content to the wrong file.
5. Removing Duplicate Transaction Entries
Duplicate transactions are a silent risk in accounting data. A payment processed twice. An invoice imported from two different system exports. An expense logged by the manager and also auto-imported from the credit card statement. Duplicates inflate totals, distort averages, and create reconciliation discrepancies that take hours to trace back to their source. And because they often look identical to legitimate entries, they're genuinely hard to catch manually in large datasets.
The Deduplicate tool gives finance teams precise control over how duplicates are handled. You can highlight duplicates first — so you can review them before deciding — then choose to delete them while keeping the row structure intact, copy only the unique entries to a clean new sheet, or extract just the duplicates with occurrence counts to understand the scale of the problem. For accounting data quality, the ability to audit before acting is as important as the deduplication itself.
6. Fixing Numbers That Won't Calculate After a Software Export
Every accountant who has imported data from a management system, ERP, or accounting platform into Excel has encountered this: a column of figures that looks like numbers but won't sum, won't sort correctly, and returns errors in every formula you try to apply. The SUM function returns zero. The column sorts alphabetically instead of numerically. The issue is numbers stored as text — one of the most common problems with data exported from financial software — and it invalidates every calculation in the file until it's fixed.
The Data Fixer tool resolves this with a single operation. The Convert text to numbers option processes the entire selection and converts every text-formatted number to a proper numeric value that Excel can calculate with. Applied to the whole sheet or the entire workbook, it fixes every affected column at once — no manual cell-by-cell conversion, no paste-special workaround, no helper column. Your SUM totals, averages, and variance calculations start working correctly the moment it runs.
7. Filling Missing Cost Center Labels in Exported Reports
Many ERP and accounting software exports use a grouped format for cost center or department labels: the label appears once at the top of a group, with all subsequent rows in that group left blank beneath it. It reads clearly as a printed report, but in Excel it's a data quality problem — every blank cell in the cost center column breaks filters, pivot tables, and any formula that depends on that field having a value in every row.
The Fill Blanks tool fills every empty cell in a selected column using the value from the cell directly above it — exactly what's needed to propagate cost center, department, or account labels down through each group. Select the column, choose the cell above option, click Fill Now. In a single operation, every blank is correctly populated, and your financial pivot tables, cost summaries, and departmental filters all work exactly as expected. It's a small fix that has an outsized impact on the usability of every exported financial report.
Stop Letting Data Prep Eat Your Reporting Time
Finance and accounting professionals are not paid to clean data. They're paid to understand it, report on it, and make decisions with it. But in practice, a significant portion of every reporting cycle disappears into exactly the kind of manual preparation work described above — fixing exports, reconciling lists, reformatting files, splitting reports. It's necessary, unavoidable, and largely invisible to anyone who doesn't do it.
XLclick puts 34 tools built for this kind of work directly in your Excel ribbon. No formulas to write, no VBA to maintain, no external tools to switch between. Just the operation you need, available with a single click, every time a new export lands in your inbox. If financial data cleanup in Excel is a fixed cost of your reporting workflow, these tools are the fastest way to reduce it.

Excel has always been my laboratory. After years of navigating data-heavy workflows, I created XLclick: the definitive add-in that simplifies complex analysis into a single click. It’s built for pros who want to spend less time on spreadsheets and more time on strategy.